Español
 Download
 Contact
MORE THANDISTRIBUTION2013 ANNUAL REPORT

The Key to Success: DIVERSIFICATION
During 2013, we continue working on our strategy of diversifying customers, products, markets and regions in order to avoid risk concentration.
This diversification allows us to protect the creditworthiness of our receivable portfolio as well as our gross margin levels, to reduce the impact of price reductions in certain products, and the demand contractions in specific industries or geographic regions and the scarcity, obsolescence or regulatory obstacles that might affect a particular product.
We are convinced that this strategy enhances the adaptation capacity of our business, allowing us to minimize the impact of falling prices, recessions in certain industries or regions, obsolescence or product shortage, bankruptcy or defaults of customers and other fluctuations in the market. Our sales growth and sustained improvement in margins in recent years, in spite of weak demand and falling prices, validate this strategy. During 2013, our sales grew 15% due to a 40% increase in tons sold.
CUSTOMERS
We maintain business relationships with over 27,000 active customers operating on a broadly diversified range of markets.
We continued to consolidate our model of risk diversification during 2013. Our top five customers went from 11.6% of sales in 2012 to 9.4% in 2013, with none reaching 3% of sales.
|
|
Part % 2013 |
Part % 2012 |
|---|---|---|
|
Customer 1 |
2.84% |
3.96% |
|
Customer 2 |
2.05% |
2.33% |
|
Customer 3 |
1.78% |
2.07% |
|
Customer 4 |
1.46% |
1.82% |
|
Customer 5 |
1.24% |
1.43% |
|
TOTAL |
9.38% |
11.61% |
PRODUCT
In addition to strengthening our proposed “one-stop shop” offer, our portfolio of over 5,500 products allows us to minimize reliance on any item individually. Our most important product represents 2.3% of the sales and, in total, the top five represent 8.3%, which enable us to moderate the impact of certain vicissitudes such as price fluctuations, shortages or obsolescence of products.
|
|
Part % 2013 |
Part % 2012 |
|---|---|---|
|
Product 1 |
2.36% |
1.79% |
|
Product 2 |
1.75% |
1.56% |
|
Product 3 |
1.60% |
1.16% |
|
Product 4 |
1.37% |
1.03% |
|
Product 5 |
1.23% |
0.90% |
|
TOTAL |
8.32% |
6.43% |
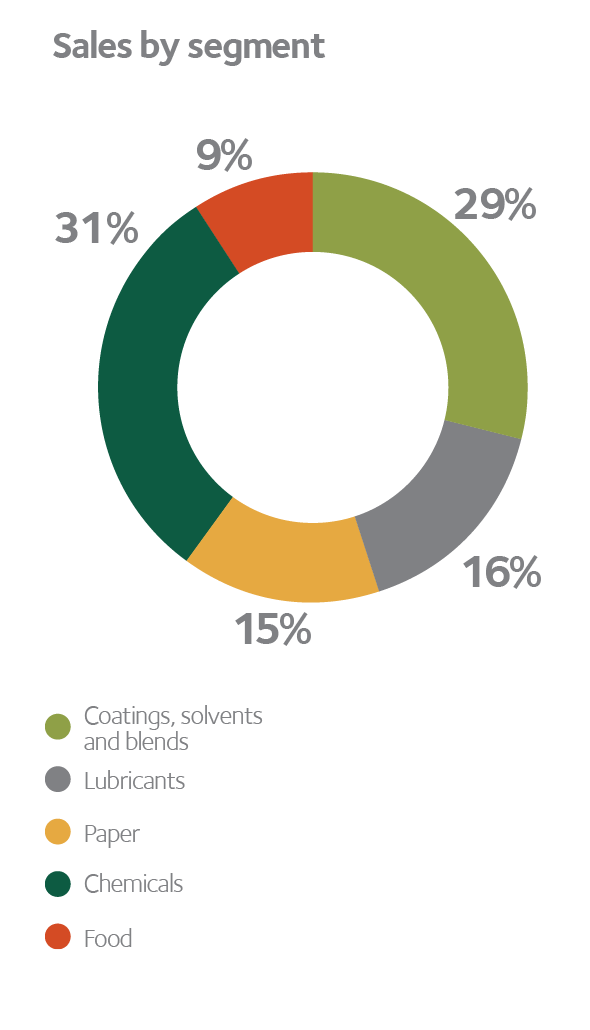
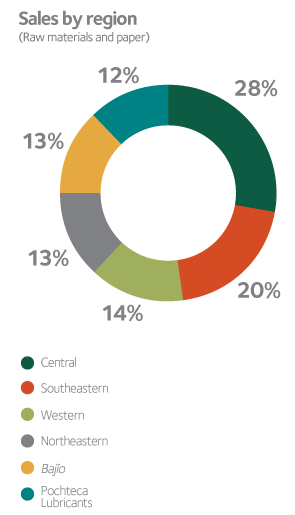

Markets and regions