| 2016 | 2015 | variation % | |
|---|---|---|---|
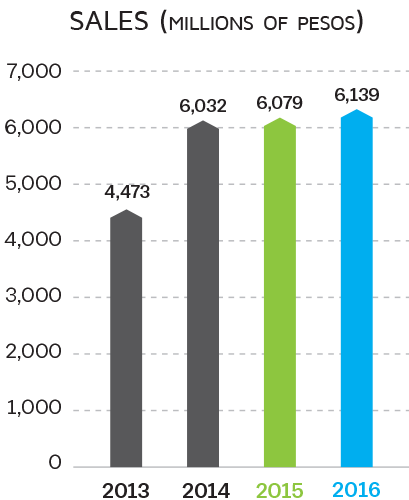
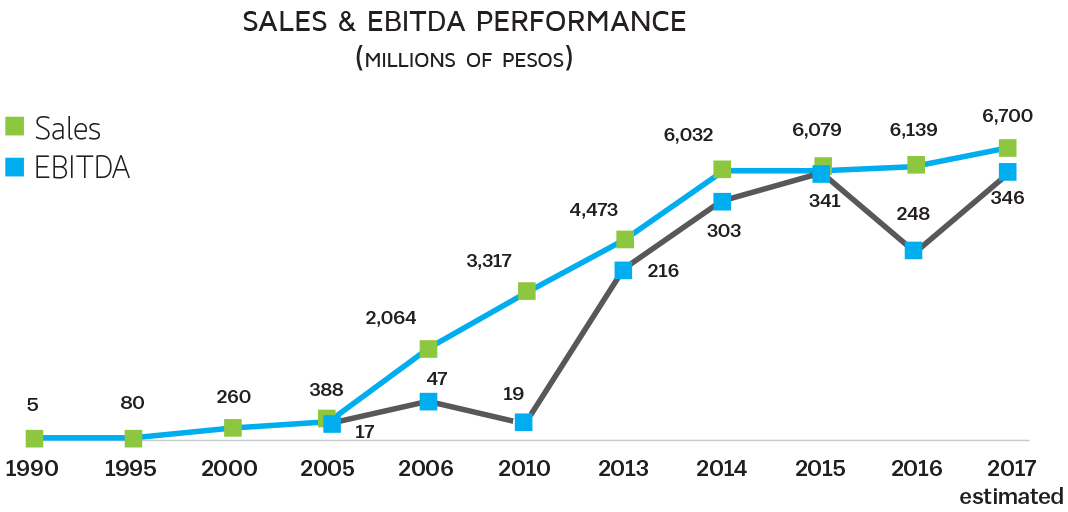
| Sales | 6,139 | 6,079 | 1% |
| Gross Income | 1,075 | 1,106 | -3% |
| Gross Margin (%) | 17.5% | 18.2% | -70pb |
| Operating Income | 116 | 223 | -48% |
| Operating Margin (%) | 1.9% | 3.7% | -180pb |
| Depreciation | 132 | 118 | 12% |
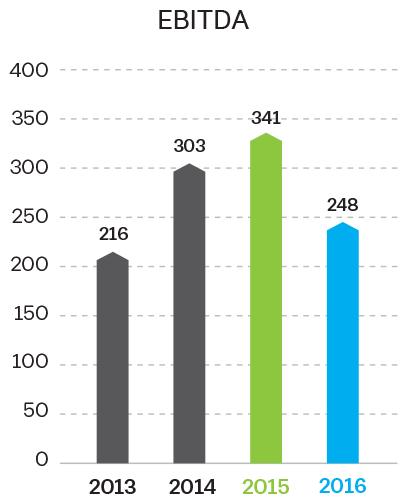
| EBITDA | 248 | 341 | -27% |
| EBITDA Margin (%) | 4.0% | 5.6% | -160pb |
| Financial Expense | 81 | 99 | -18% |
| Forex Gain (Loss) | (50) | (94) | -47% |
| Pre-tax Income | (15) | 30 | NC |
| Net Income (Loss) | (6) | 34 | NC |
| Net Debt/ EBITDA 12M | 2.9x | 1.6x | |
| EBITDA/ Interest 12M | 2.6x | 3.0x |